TheLabour Bureau, an attached office of the M/o Labour & Employment, has been compiling Consumer Price Index for Industrial Workers every month on the basis of retail prices collected from 317 markets spread over 88 industrially important centres in the country. The index is compiled for 88 centres and All-India and is released on the last working day of succeeding month. The index for the month of July, 2022is being released in this press release.
The All-India CPI-IW for July, 2022increased by 0.7 points and stood at 129.9 (one hundred twenty nine point nine). On 1-month percentage change, it increased by 0.54 per cent with respect to previous month compared to an increase of 0.90 per cent recorded between corresponding months a year ago.
The maximum upward pressure in current index came from Housing group contributing 0.37 percentage points to the total change. At item level Cooking Gas, Electricity Domestic, Potato, Onion, Gourd, Mango, Banana, Chillies Dry, Cooked Meal, Wheat, Wheat Atta, Arhar Dal, Tur Dal etc. are responsible for the rise in index. However, this increase was largely checked by Tomato, Poultry Chicken, Soyabeen oil, Sunflower Oil, Mustard oil, Palm Oil, Rice, Apple, Lemon, Radish, Garlic, Drum Stick etc. putting downward pressure on the index.
At centre level, Udham Singh Nagar recorded a maximum increase of 3.8 points followed by Jalpaiguri and Jalandhar with 3.3 and 3.2 points respectively. Among others, 9 centres recorded increase between 2 to 2.9 points, 32 centres between 1 to 1.9 points and 24 centres between 0.1 to 0.9 points. On the contrary, Salem recorded a maximum decrease of 4.1 points. Among others, 2 centers recorded decrease between 2 to 2.9 points, 3 centers between 1 to 1.9 points and 11 centres between 0.1 to 0.9 points. Rest of 3 centres’ indices remained stationary.
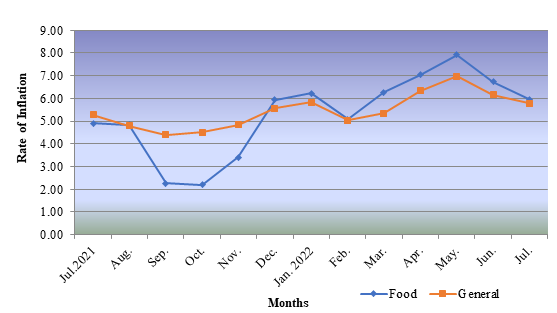
Year-on-year inflation for the month stood at 5.78 per cent compared to 6.16 per cent for the previous month and 5.26 per cent during the corresponding month a year before. Similarly, Food inflation stood at 5.96 per cent against 6.73 per cent of the previous month and 4.91per cent during the corresponding month a year ago.
Y-o-Y Inflation based on CPI-IW (Food and General)
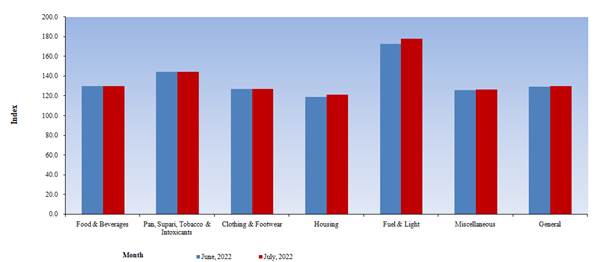
All-India Group-wise CPI-IW for June, 2022and July, 2022
Sr. No.
Groups
June, 2022
July, 2022
I
Food & Beverages
130.0
129.7
II
Pan, Supari, Tobacco & Intoxicants
144.4
144.4
III
Clothing & Footwear
127.0
127.2
IV
Housing
118.9
121.0
V
Fuel & Light
172.8
178.2
VI
Miscellaneous
125.9
126.1
General Index
129.2
129.9
CPI-IW: Groups Indices
The next issue of CPI-IW for the month of August, 2022 will be released on Friday, 30th September, 2022. The same will also be available on the office website www.labourbureaunew.gov.in.
TheLabour Bureau, an attached office of the M/o Labour & Employment, has been compiling Consumer Price Index for Industrial Workers every month on the basis of retail prices collected from 317 markets spread over 88 industrially important centres in the country. The index is compiled for 88 centres and All-India and is released on the last working day of succeeding month. The index for the month of June, 2022is being released in this press release.
The All-India CPI-IW for June, 2022increased by 0.2 points and stood at 129.2 (one hundred twenty nine point two). On 1-month percentage change, it increased by 0.16 per cent with respect to previous month compared to an increase of 0.91 per cent recorded between corresponding months a year ago.
The maximum upward pressure in current index came from Food & Beverages group contributing 0.20 percentage points to the total change. At item level Potato, Onion, Tomato, Cabbage, Apple, Banana, Coriander, Chilly Dry, Fish Fresh, Poultry Chicken, Vada, Idli Dosa, Cooked Meal, Cooking Gas, kerosene Oil, Electricity Domestic etc. are responsible for the rise in index. However, this increase was largely checked by Petrol for Vehicle, Rice, Mango, Chilli Green, Lemon, Lady Finger, Parwal, Pineapple, Soyabeen Oil, Sunflower Oil etc. putting downward pressure on the index.
At centre level, Puducherry recorded a maximum increase of 2.6 points followed by Amritsar and Tripura with 2.2 and 2.0 points respectively. Among others, 15 centres recorded increase between 1 to 1.9 points, 33 centres between 0.1 to 0.9 points. On the contrary, Sangrur recorded a maximum decrease of 2.4 points. Among others, 5 centers recorded decrease between 1 to 1.9 points, 25 centres between 0.1 to 0.9 points. Rest of 6 centres’ indices remained stationary.
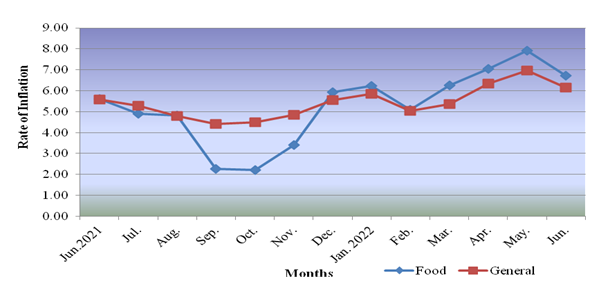
Year-on-year inflation for the month stood at 6.16 per cent compared to 6.97 per cent for the previous month and 5.57 per cent during the corresponding month a year before. Similarly, Food inflation stood at 6.73 per cent against 7.92 per cent of the previous month and 5.61per cent during the corresponding month a year ago.
Y-o-Y Inflation based on CPI-IW (Food and General)
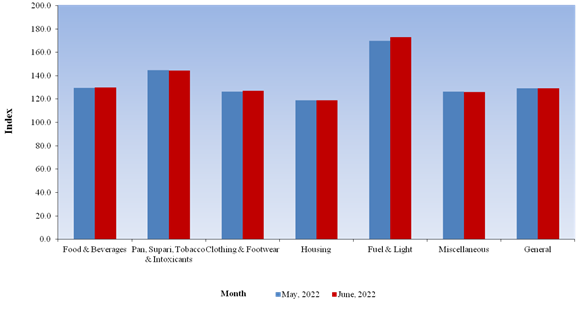
All-India Group-wise CPI-IW for May,2022 and June,2022
Sr. No.
Groups
May,2022
June,2022
I
Food & Beverages
129.5
130.0
II
Pan, Supari, Tobacco & Intoxicants
144.7
144.4
III
Clothing & Footwear
126.5
127.0
IV
Housing
118.9
118.9
V
Fuel & Light
169.7
172.8
VI
Miscellaneous
126.4
125.9
General Index
129.0
129.2
CPI-IW: Groups Indices
The next issue of CPI-IW for the month of July, 2022 will be released on Wednesday, 31st August, 2022. The same will also be available on the office website www.labourbureaunew.gov.in.
The National Statistical Office (NSO), Ministry of Statistics and Programme Implementation (MoSPI) is releasing All India Consumer Price Index (CPI) on Base 2012=100 and corresponding Consumer Food Price Index (CFPI) for Rural (R), Urban (U) and Combined (C) for the month of February 2022 (Provisional) in this press note. CPIs for Sub-Groups and Groups for both All India and all States/UTs are also being released.
2. The Price data are collected from selected 1114 urban Markets and 1181 villages covering all States/UTs through personal visits by field staff of Field Operations Division of NSO, MoSPI on a weekly roster. During the month of February 2022, NSO collected prices from 99.6% villages and 98.2% urban Markets while the Market-wise prices reported therein were 89.6% for rural and 92.9% for urban.
3. All India Inflation rates (on point to point basis i.e. current month over same month of last year, i.e. February 2022 over February 2021), based on General Indices and CFPIs are given as follows:
All India Inflation rates (%) based on CPI (General) and CFPI
Indices
Feb. 2022 (Prov.)
Jan. 2022 (Final)
Feb. 2021
Rural
Urban
Combd.
Rural
Urban
Combd.
Rural
Urban
Combd.
CPI (General)
6.38
5.75
6.07
6.12
5.91
6.01
4.19
5.96
5.03
CFPI
5.87
5.76
5.85
5.18
5.88
5.43
2.89
5.63
3.87
Notes: Prov. – Provisional, Combd. – Combined
4.Monthly changes in the General Indices and CFPIs are given below:
Monthly changes (%) in All India CPI (General) and CFPI: February, 2022 over January,2022
Indices
Rural
Urban
Combined
Index Value
% Change
Index Value
% Change
Index Value
% Change
Feb.22
Jan.22
Feb.22
Jan.22
Feb.22
Jan.22
CPI (General)
166.7
166.4
0.18
165.5
165.0
0.30
166.1
165.7
0.24
CFPI
162.3
162.5
-0.12
168.8
169.2
-0.24
164.6
164.9
-0.18
Note: Figures of February 2022 are provisional.
5.Price data for CPI are received through web portals, maintained by the National Informatics Centre.
Next date of release: 12th April 2022 (Tuesday) for March 2022.
List of Annex
Annex
Title
I
All-India General (all-groups), Group and Sub-group level CPI and CFPI numbers for January 2022 (Final) and February 2022 (Provisional) for Rural, Urban and Combined
II
All-India inflation rates for General (all-groups), Group and Sub-group level CPI and CFPI numbers for February 2022 (Provisional) for Rural, Urban and Combined
III
General CPI for States for Rural, Urban and Combined for January 2022 (Final) and February 2022 (Provisional)
IV
Inflation rates of major States, having population more than 50 lakhs as per Population Census 2011, for Rural, Urban and Combined for February 2022 (Provisional)
Annex I
All India Consumer Price Indices
(Base: 2012=100)
Group Code
Sub-group Code
Description
Rural
Urban
Combined
Weights
Jan. 22 Index
(Final)
Feb. 22 Index
(Prov.)
Weights
Jan. 22 Index
(Final)
Feb. 22 Index
(Prov.)
Weights
Jan. 22 Index
(Final)
Feb. 22 Index
(Prov.)
(1)
(2)
(3)
(4)
(5)
(6)
(7)
(8)
(9)
(10)
(11)
(12)
1.1.01
Cereals and products
12.35
148.3
148.8
6.59
152.2
152.5
9.67
149.5
150.0
1.1.02
Meat and fish
4.38
196.9
198.1
2.73
202.1
205.1
3.61
198.7
200.6
1.1.03
Egg
0.49
178.0
175.5
0.36
180.1
176.4
0.43
178.8
175.8
1.1.04
Milk and products
7.72
160.5
160.7
5.33
160.4
160.5
6.61
160.5
160.6
1.1.05
Oils and fats
4.21
192.6
192.6
2.81
171.0
171.5
3.56
184.7
184.9
1.1.06
Fruits
2.88
151.2
151.4
2.90
156.5
156.4
2.89
153.7
153.7
1.1.07
Vegetables
7.46
159.2
155.3
4.41
203.6
198.0
6.04
174.3
169.8
1.1.08
Pulses and products
2.95
164.0
163.9
1.73
163.8
163.2
2.38
163.9
163.7
1.1.09
Sugar and Confectionery
1.70
119.3
118.1
0.97
121.3
120.6
1.36
120.0
118.9
1.1.10
Spices
3.11
173.3
175.3
1.79
169.8
172.1
2.50
172.1
174.2
1.2.11
Non-alcoholic beverages
1.37
169.8
170.5
1.13
156.6
156.7
1.26
164.3
164.7
1.1.12
Prepared meals, snacks, sweets etc.
5.56
175.8
176.3
5.54
179.0
180.0
5.55
177.3
178.0
1
Food and beverages
54.18
164.1
163.9
36.29
170.3
170.1
45.86
166.4
166.2
2
Pan, tobacco and intoxicants
3.26
190.7
191.5
1.36
196.4
196.5
2.38
192.2
192.8
3.1.01
Clothing
6.32
173.2
174.2
4.72
164.7
165.7
5.58
169.9
170.9
3.1.02
Footwear
1.04
169.3
171.0
0.85
148.5
150.4
0.95
160.7
162.4
3
Clothing and footwear
7.36
172.7
173.7
5.57
162.2
163.4
6.53
168.5
169.6
4
Housing
–
–
–
21.67
164.5
165.5
10.07
164.5
165.5
5
Fuel and light
7.94
165.8
167.3
5.58
161.6
163.0
6.84
164.2
165.7
6.1.01
Household goods and services
3.75
164.9
165.7
3.87
156.8
157.4
3.80
161.1
161.8
6.1.02
Health
6.83
174.7
175.3
4.81
166.1
167.2
5.89
171.4
172.2
6.1.03
Transport and communication
7.60
160.8
161.1
9.73
152.7
153.1
8.59
156.5
156.9
6.1.04
Recreation and amusement
1.37
164.9
165.5
2.04
158.4
159.4
1.68
161.2
162.1
6.1.05
Education
3.46
169.9
170.3
5.62
161.0
162.0
4.46
164.7
165.4
6.1.06
Personal care and effects
4.25
163.2
164.5
3.47
162.8
164.1
3.89
163.0
164.3
6
Miscellaneous
27.26
166.6
167.2
29.53
158.6
159.4
28.32
162.7
163.4
General Index (All Groups)
100.00
166.4
166.7
100.00
165.0
165.5
100.00
165.7
166.1
Consumer Food Price Index (CFPI)
47.25
162.5
162.3
29.62
169.2
168.8
39.06
164.9
164.6
Notes:
Prov. : Provisional.
CFPI : Out of 12 sub-groups contained in ‘Food and Beverages’ group, CFPI is based on ten sub-groups, excluding ‘Non-alcoholic beverages’ and ‘Prepared meals, snacks, sweets etc.’.
– : CPI (Rural) for housing is not compiled.
Annex II
All India year-on-year inflation rates (%) for February 2022 (Provisional)
(Base: 2012=100)
Group Code
Sub-group Code
Description
Rural
Urban
Combined
Feb. 21 Index
(Final)
Feb. 22
Index
(Prov.)
Inflation Rate
(%)
Feb. 21 Index
(Final)
Feb. 22
Index
(Prov.)
Inflation Rate
(%)
Feb. 21 Index
(Final)
Feb. 22
Index
(Prov.)
Inflation Rate
(%)
(1)
(2)
(3)
(4)
(5)
(6)
(7)
(8)
(9)
(10)
(11)
(12)
1.1.01
Cereals and products
142.8
148.8
4.20
147.6
152.5
3.32
144.3
150.0
3.95
1.1.02
Meat and fish
184.2
198.1
7.55
191.3
205.1
7.21
186.7
200.6
7.45
1.1.03
Egg
168.0
175.5
4.46
170.1
176.4
3.70
168.8
175.8
4.15
1.1.04
Milk and products
154.5
160.7
4.01
155.1
160.5
3.48
154.7
160.6
3.81
1.1.05
Oils and fats
163.1
192.6
18.09
151.5
171.5
13.20
158.8
184.9
16.44
1.1.06
Fruits
147.2
151.4
2.85
153.9
156.4
1.62
150.3
153.7
2.26
1.1.07
Vegetables
149.7
155.3
3.74
180.0
198.0
10.00
160.0
169.8
6.13
1.1.08
Pulses and products
158.4
163.9
3.47
159.8
163.2
2.13
158.9
163.7
3.02
1.1.09
Sugar and Confectionery
111.8
118.1
5.64
114.8
120.6
5.05
112.8
118.9
5.41
1.1.10
Spices
165.0
175.3
6.24
162.6
172.1
5.84
164.2
174.2
6.09
1.2.11
Non-alcoholic beverages
160.1
170.5
6.50
149.3
156.7
4.96
155.6
164.7
5.85
1.1.12
Prepared meals, snacks, sweets etc.
165.8
176.3
6.33
169.4
180.0
6.26
167.5
178.0
6.27
1
Food and beverages
154.7
163.9
5.95
160.8
170.1
5.78
156.9
166.2
5.93
2
Pan, tobacco and intoxicants
186.5
191.5
2.68
193.3
196.5
1.66
188.3
192.8
2.39
3.1.01
Clothing
159.2
174.2
9.42
154.3
165.7
7.39
157.3
170.9
8.65
3.1.02
Footwear
154.0
171.0
11.04
138.3
150.4
8.75
147.5
162.4
10.10
3
Clothing and footwear
158.4
173.7
9.66
151.8
163.4
7.64
155.8
169.6
8.86
4
Housing
–
–
–
159.8
165.5
3.57
159.8
165.5
3.57
5
Fuel and light
154.4
167.3
8.35
149.2
163.0
9.25
152.4
165.7
8.73
6.1.01
Household goods and services
154.8
165.7
7.04
146.5
157.4
7.44
150.9
161.8
7.22
6.1.02
Health
164.3
175.3
6.70
156.2
167.2
7.04
161.2
172.2
6.82
6.1.03
Transport and communication
150.2
161.1
7.26
140.5
153.1
8.97
145.1
156.9
8.13
6.1.04
Recreation and amusement
157.2
165.5
5.28
147.3
159.4
8.21
151.6
162.1
6.93
6.1.05
Education
163.7
170.3
4.03
156.7
162.0
3.38
159.6
165.4
3.63
6.1.06
Personal care and effects
155.2
164.5
5.99
156.8
164.1
4.66
155.9
164.3
5.39
6
Miscellaneous
157.2
167.2
6.36
149.3
159.4
6.76
153.4
163.4
6.52
General Index (All Groups)
156.7
166.7
6.38
156.5
165.5
5.75
156.6
166.1
6.07
Consumer Food Price Index
153.3
162.3
5.87
159.6
168.8
5.76
155.5
164.6
5.85
Notes:
Prov. : Provisional.
– : CPI (Rural) for housing is not compiled.
Annex III
State/UT wise General Consumer Price Indices
(Base: 2012=100)
Sl. No.
Name of the State/UT
Rural
Urban
Combined
Weights
Jan. 22 Index
(Final)
Feb. 22 Index
(Prov.)
Weights
Jan. 22 Index
(Final)
Feb. 22 Index
(Prov.)
Weights
Jan. 22 Index
(Final)
Feb. 22 Index
(Prov.)
(1)
(2)
(3)
(4)
(5)
(6)
(7)
(8)
(9)
(10)
(11)
1
Andhra Pradesh
5.40
167.3
167.3
3.64
170.3
170.9
4.58
168.4
168.6
2
Arunachal Pradesh
0.14
174.1
174.0
0.06
—
—
0.10
174.1
174.0
3
Assam
2.63
169.4
168.6
0.79
167.0
167.1
1.77
168.9
168.3
4
Bihar
8.21
162.1
162.0
1.62
167.6
168.0
5.14
162.9
162.9
5
Chhattisgarh
1.68
164.3
164.8
1.22
162.7
162.5
1.46
163.7
163.9
6
Delhi
0.28
159.6
159.8
5.64
159.1
159.4
2.77
159.1
159.4
7
Goa
0.14
167.3
169.3
0.25
162.0
162.2
0.19
164.1
164.9
8
Gujarat
4.54
162.1
162.6
6.82
155.7
155.8
5.60
158.5
158.8
9
Haryana
3.30
161.8
162.2
3.35
158.3
158.8
3.32
160.2
160.6
10
Himachal Pradesh
1.03
159.8
160.4
0.26
163.7
164.7
0.67
160.5
161.2
11
Jharkhand
1.96
163.3
163.8
1.39
167.0
167.6
1.69
164.7
165.3
12
Karnataka
5.09
168.2
167.5
6.81
174.0
173.7
5.89
171.3
170.8
13
Kerala
5.50
172.9
172.6
3.46
171.0
171.6
4.55
172.2
172.2
14
Madhya Pradesh
4.93
163.7
164.7
3.97
166.7
168.0
4.48
164.9
166.1
15
Maharashtra
8.25
167.6
167.7
18.86
160.7
161.6
13.18
163.0
163.6
16
Manipur
0.23
183.9
183.2
0.12
171.6
169.1
0.18
180.0
178.7
17
Meghalaya
0.28
158.8
158.4
0.15
162.7
161.8
0.22
160.0
159.5
18
Mizoram
0.07
170.3
173.1
0.13
164.0
164.2
0.10
166.5
167.7
19
Nagaland
0.14
177.6
179.0
0.12
163.6
163.7
0.13
171.6
172.5
20
Odisha
2.93
167.2
167.4
1.31
162.0
162.8
2.18
165.7
166.1
21
Punjab
3.31
161.4
162.5
3.09
153.1
153.6
3.21
157.7
158.5
22
Rajasthan
6.63
162.4
163.7
4.23
162.3
163.4
5.51
162.4
163.6
23
Sikkim
0.06
182.4
183.2
0.03
169.3
171.7
0.05
178.1
179.4
24
Tamil Nadu
5.55
172.8
172.2
9.20
172.9
171.9
7.25
172.9
172.0
25
Telangana
3.16
174.0
174.1
4.41
169.3
169.8
3.74
171.4
171.7
26
Tripura
0.35
182.1
180.6
0.14
170.8
170.7
0.25
179.2
178.0
27
Uttar Pradesh
14.83
163.1
163.9
9.54
165.0
165.2
12.37
163.8
164.4
28
Uttarakhand
1.06
163.0
163.7
0.73
163.9
164.0
0.91
163.3
163.8
29
West Bengal
6.99
172.4
173.0
7.20
171.1
173.5
7.09
171.8
173.2
30
Andaman & Nicobar Islands
0.05
184.9
182.3
0.07
168.1
166.0
0.06
176.4
174.0
31
Chandigarh
0.02
167.0
167.5
0.34
156.2
157.0
0.17
156.8
157.6
32
Dadra & Nagar Haveli
0.02
154.1
154.0
0.04
160.1
160.9
0.03
158.1
158.6
33
Daman & Diu
0.02
171.4
169.8
0.02
164.4
164.2
0.02
168.5
167.5
34
Jammu & Kashmir*
1.14
176.6
177.4
0.72
174.4
176.3
0.94
175.8
177.0
35
Lakshadweep
0.01
176.6
176.9
0.01
157.7
154.8
0.01
166.9
165.6
36
Puducherry
0.08
173.0
172.4
0.27
170.7
172.1
0.17
171.3
172.2
All India
100.00
166.4
166.7
100.00
165.0
165.5
100.00
165.7
166.1
Notes:
Prov. : Provisional
— : indicates the receipt of price schedules is less than 80% of allocated schedules and therefore indices are not compiled.
* : Figures of this row pertain to the prices and weights of the combined Union Territories of Jammu & Kashmir
and Ladakh (erstwhile State of Jammu & Kashmir).
Annex IV
Major State/UT wise year-on-year inflation rates (%) for February 2022 (Provisional)
(Base: 2012=100)
Sl. No.
Name of the State/UT
Rural
Urban
Combined
Feb. 21 Index
(Final)
Feb. 22
Index
(Prov.)
Inflation Rate
(%)
Feb. 21 Index
(Final)
Feb. 22
Index
(Prov.)
Inflation Rate
(%)
Feb. 21 Index
(Final)
Feb. 22
Index
(Prov.)
Inflation Rate
(%)
(1)
(2)
(3)
(4)
(5)
(6)
(7)
(8)
(9)
(10)
(11)
1
Andhra Pradesh
160.3
167.3
4.37
161.4
170.9
5.89
160.7
168.6
4.92
2
Assam
157.4
168.6
7.12
159.7
167.1
4.63
157.9
168.3
6.59
3
Bihar
153.1
162.0
5.81
158.7
168.0
5.86
153.9
162.9
5.85
4
Chhattisgarh
154.6
164.8
6.60
153.8
162.5
5.66
154.3
163.9
6.22
5
Delhi
152.8
159.8
4.58
150.7
159.4
5.77
150.8
159.4
5.70
6
Gujarat
151.9
162.6
7.04
147.2
155.8
5.84
149.2
158.8
6.43
7
Haryana
150.4
162.2
7.85
149.7
158.8
6.08
150.1
160.6
7.00
8
Himachal Pradesh
150.6
160.4
6.51
155.2
164.7
6.12
151.4
161.2
6.47
9
Jharkhand
152.8
163.8
7.20
157.2
167.6
6.62
154.5
165.3
6.99
10
Karnataka
160.1
167.5
4.62
164.1
173.7
5.85
162.3
170.8
5.24
11
Kerala
166.8
172.6
3.48
163.6
171.6
4.89
165.7
172.2
3.92
12
Madhya Pradesh
153.2
164.7
7.51
158.6
168.0
5.93
155.4
166.1
6.89
13
Maharashtra
156.9
167.7
6.88
151.3
161.6
6.81
153.2
163.6
6.79
14
Odisha
158.5
167.4
5.62
155.1
162.8
4.96
157.5
166.1
5.46
15
Punjab
155.2
162.5
4.70
149.2
153.6
2.95
152.5
158.5
3.93
16
Rajasthan
153.9
163.7
6.37
154.1
163.4
6.04
154.0
163.6
6.23
17
Tamil Nadu
164.9
172.2
4.43
165.1
171.9
4.12
165.0
172.0
4.24
18
Telangana
162.0
174.1
7.47
159.9
169.8
6.19
160.8
171.7
6.78
19
Uttar Pradesh
151.8
163.9
7.97
156.9
165.2
5.29
153.6
164.4
7.03
20
Uttarakhand
153.9
163.7
6.37
154.0
164.0
6.49
153.9
163.8
6.43
21
West Bengal
159.3
173.0
8.60
161.8
173.5
7.23
160.5
173.2
7.91
22
Jammu & Kashmir*
165.5
177.4
7.19
165.1
176.3
6.78
165.4
177.0
7.01
All India
156.7
166.7
6.38
156.5
165.5
5.75
156.6
166.1
6.07
Notes:
Prov. : Provisional.
* : Figures of this row pertain to the prices and weights of the combined Union Territories of Jammu & Kashmir and Ladakh (erstwhile State of Jammu & Kashmir).
A far-sighted policy decision taken by Khadi and Village Industries Commission (KVIC) in 2018, to create a special reserve fund to deal with market fluctuations and other eventualities, has come as a savior for all Khadi institutions across the country, just when the entire textile industry is grappling with a steep price hike of the raw cotton.
In 2018, KVIC had decided to create a Products Price Adjustment Account (PPA), a Reserve Fund for its 5 Central Sliver Plants (CSPs), to meet market-driven eventualities. These CSPs are purchasing cotton and converting it into sliver and roving for the supply of Khadi Institutions, which converts it into yarn and fabric. The PPA fund was created by transferring just 50 paise to it from each kilogram of the total sliver/roving soldby these CSPs.
Three years down the line, when the entire textile sector is facing the brunt of short-supply and a steep hike in the price of raw cotton, KVIC has decided not to increase the cost of sliver/roving being supplied to the Khadi institutions by its sliver plants across the country despite the cotton prices surging by over 110 percent. Instead, KVIC will bear the excess cost of Rs 4.06 crore on procurement of raw cotton bales at the increased rates from the PPA Fund.
It is pertinent to mention here that the price of raw cotton has increased from Rs 36,000 per candy to Rs 78,000 per candy (each candy weighs 365 KG) in the last 16 months. This has put a direct impact on production of cotton apparels by major textile companiesacross the country,that have also reduced the production by 30 to 35 percent in the recent months.
This decision of KVIC, which has been taken for the first time to create such reserve fund, comes as a big relief for over 2700 registered Khadi institutions and over 8000 Khadi India Outlets that are already grappling with production&marketing challenges due to restrictions imposed during Covid-19 pandemic.
KVIC largely purchases cotton bales from Cotton Corporation of India (CCI) for its 5 CSPs located at Kuttur, Chitradurga, Sehore, Raebareli and Hajipur, that convert various varieties of cotton into sliver and roving. The Cotton varieties purchased by KVIC are BB mod, Y-1/S-4, H-4/J-34, LRA/MECH, MCU_5 and DCH_32. The Price difference reported in these days is from Rs 13000 per candy to Rs 40000 per candy of these varieties. KVIC will require 6370 cotton bales of different varieties by 31st of March 2022 which, as per the current rate, will cost Rs 13.25 crores as against Rs 9.20 crores as per the old rates.The price difference of Rs 4.05 crores will be met from the PPA reserve created by KVIC in these days.
The reserve fund has ensured that the Khadi institutions in the country remain unaffected by the price rise and the prices of Khadi cotton apparels also do not go up.
KVIC Chairman Shri Vinai Kumar Saxena said that this decision would save both the Khadi institutions as well as the Khadi buyers from any adverse impact of price rise. “Short supply of raw cotton from CCI and the consequent rise in price of cotton has hit the entire textile industry including Khadi. But KVIC has decided to continue the supply of roving/sliver to Khadi institutions at the old rates so as mitigate any financial burden on the institutions. At the same time, it will also benefit crores of Khadi buyers as there will be no increase in the price of Khadi fabric and garments. It is KVIC’s commitment to every Khadi buyer to provide Khadi at affordable prices in tune with Hon’ble Prime Minister’s vision of “Khadi for Nation”, Saxena said.
Khadi has nearly 9 percent share in the Indian textile industry and produces nearly 150 million Sq Mtr fabric per year. With this decision, Khadi has emerged as the only entity that is unaffected by the steep price rise of cotton. Khadi buyers and Khadi institutions, thus, have a reason to rejoice.
Khadi Institutions have unanimously welcomed the move and thanked KVIC for the big support saying this would safeguard the institutions against any market adversities. “Cotton prices have gone up by over Rs 70 per KG. This step of KVIC will help Khadi Institutions survive during these difficult times. Any hike in the price of sliver and roving would have put a huge financial burden on Khadi institutions that are yet to recover from the impact of Covid19,” said Shri Sarthank Singla, Secretary of Khadi Udyog Jathlana, Ambala.
Shri Sanjay Shah of Bharat Khadi Gramodyog Sangh, Ahmedabad, said that hike in cotton prices would have a direct bearing on the production of Khadi and wages of the artisans. “If the cost of raw material goes up, the production will naturally come down and so will the wages being given to the artisans. I am thankful to KVIC that has saved the institutions and artisans from the crisis,” he said.
TheLabour Bureau, an attached office of the M/o Labour & Employment, has been compiling Consumer Price Index for Industrial Workers every month on the basis of retail prices collected from 317 markets spread over 88 industrially important centres in the country. The index is compiled for 88 centres and All-India and is released on the last working day of succeeding month. The index for the month of January, 2022is being released in this press release.
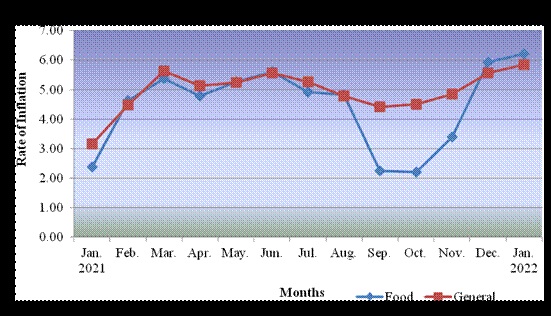
The All-India CPI-IW for January, 2022decreased by 0.3 points and stood at 125.1 (one hundred twenty five and point one). On 1-month percentage change, it decreased by 0.24 per cent with respect to previous month compared to decrease of 0.51 per cent recorded between corresponding months a year ago.
The maximum downward pressure in current index came from Food & Beverages group contributing 0.82 percentage points to the total change. At item level, Fish fresh, Mustard Oil, Apple, Carrot, French-been, Garlic, Brinjal, Cauliflower, Lady’s finger, Onion, Peas, Potato, Radish, Tomato, etc. are responsible for the fall in index. However, this decrease was checked by House rent, Rice, Wheat, Buffalo-Milk, Goat meat/Mutton, Orange, Beetroot, Chilli dry, Cooked Meals, etc. putting upward pressure on the index.
At centre level, Puducherry recorded a maximum decrease of 7.3 points. Among others, 5 centres recorded decrease between 2 to 2.9 points, 13 centres between 1 to 1.9 points and 33 centres between 0.1 to 0.9 points. On the contrary, Ludhiana recorded a maximum increase of 2.3 points. Among others, 6 centres recorded increase between 1 to 1.9 points and 26 centres between 0.1 to 0.9 points. Rest of 3 centres’ indices remained stationary.
Year-on-year inflation for the month stood at 5.84 per cent compared to 5.56 per cent for the previous month and 3.15 per cent during the corresponding month a year before. Similarly, Food inflation stood at 6.22 per cent against 5.93 per cent of the previous month and 2.38per cent during the corresponding month a year ago.
Y-o-Y Inflation based on CPI-IW (Food and General)
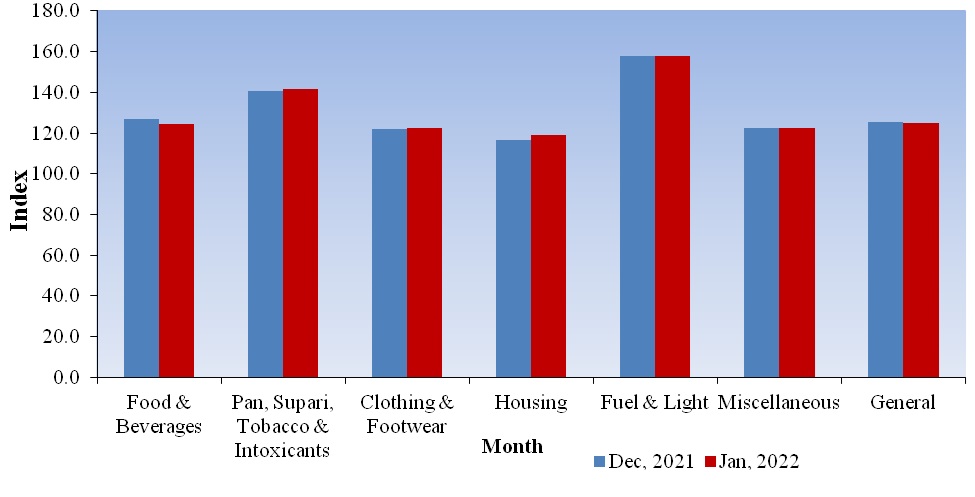
All-India Group-wise CPI-IW for December, 2021and January, 2022
Sr. No.
Groups
December, 2021
January, 2022
I
Food & Beverages
126.8
124.7
II
Pan, Supari, Tobacco & Intoxicants
140.8
141.5
III
Clothing & Footwear
122.0
122.4
IV
Housing
116.8
118.9
V
Fuel & Light
157.7
158.0
VI
Miscellaneous
122.5
122.7
General Index
125.4
125.1
CPI-IW: Groups Indices
The next issue of CPI-IW for the month of February, 2022 will be released on Thursday, 31st March, 2022. The same will also be available on the office website www.labourbureaunew.gov.in.
For “Consumer Price Index for Industrial Workers on base 2016=100”, please click here